Knowing your profitability is key for you to make data driven decisions. An income statement is a financial statement that reports a company's revenues and expenses over a specific period. It is also known as a profit and loss statement or P&L statement.
Here are the steps to read an income statement:
- Start with the revenue section: This section shows the company's total revenue generated during the period. It may also show the revenue from different sources.
- Check the operating expenses section: Operating expenses include all the expenses incurred in running the business, such as salaries, rent, utilities, marketing expenses, etc.
- Analyze the net income section: Net income is the final result after all expenses and taxes are deducted from the revenue. It indicates the overall profitability of the company during the period. The formula for calculating net income is as follows:
Income - Expenses = Net Income

By analyzing these sections, you can gain insights into a company's financial performance and understand where you’re bringing in money (and where you’re losing it):
- Are you making a profit (i.e., are you making enough in revenue to cover the cost of your expenses
- If you have more than one revenue stream, how are they performing against each other?
- Where are you spending most of your money?
- Are there any big expenses categories you might be able to lower?
The Bottom Line
An income statement is a rich source of information about the key factors responsible for a company’s profitability. It gives you timely updates because it is generated much more frequently than any other statement. The income statement shows a company’s expense, income, gains, and losses, which can be put into a mathematical equation to arrive at the net profit or loss for that time period. This information helps you make timely decisions to make sure that your business is on a good financial footing.
Profit & Loss at your Fingertips!
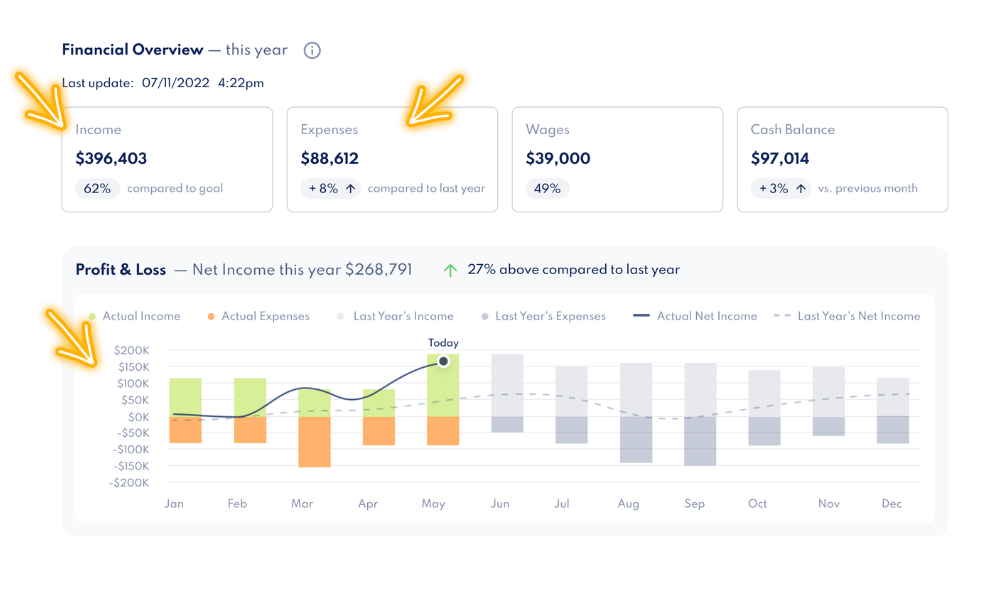
Knowing your profitability is key for you to make data driven decisions. With your Formations account, you have visibility into your business financials at all times. Formations interactive P&L graph provides you with an up-to-date understanding of your profitability. You can see your Year-to-date income, Year-to-date expenses, and understand your profits as of this date. If your income is higher than your expenses, you are in a good position!
By clicking on the “income” or “expenses” box, you can review the complete list of income or expenses as recorded up to date.
The dashboard snapshot is not an official P&L statement, but it provides you with an up-to-date understanding of your profitability. Each time a Formations formal P&L statement is created for you, it will be uploaded in your documents’ hub.
You can also review and compare your profitability in each month, by reviewing the graph. Your income is marked in green, while your expenses are marked in orange. This will allow you to understand seasonality of your business and financial trends. Formations will also display last year's income and expenses for upcoming months, if we have that information in your books. That detail can help you anticipate upcoming monthly income and expenses based on historical data.